Difference between revisions of "Research Activities"
| Line 106: | Line 106: | ||
The simulation clearly shows that the power dissipated into the load contains power at <math>f_0</math> but also at <math>n f_0</math> due to the non-linear behavior of the diode. | The simulation clearly shows that the power dissipated into the load contains power at <math>f_0</math> but also at <math>n f_0</math> due to the non-linear behavior of the diode. | ||
Harvesters use the power located at <math>n=0</math> where as harmonic transponders are based on the power located at <math>n | Harvesters use the power located at <math>n=0</math> where as harmonic transponders are based on the power located at <math>n > 1</math>. | ||
For passive harmonic transponders, an antenna accepting the power at <math>f_0</math> have to be added. The backscattered power at <math>n f_0</math> should also be re-radiated by another antenna. | For passive harmonic transponders, an antenna accepting the power at <math>f_0</math> have to be added. The backscattered power at <math>n f_0</math> should also be re-radiated by another antenna. | ||
Revision as of 12:08, 16 June 2021
My research interests include passive (or semi-passive) transponders which can not be modeled as linear time-invariant systems. These transponders have enhanced performance in term of coding capacity and read range compared to classical linear time-invariant systems. These results and can only be achieved by breaking the linearity or the time invariance associated to the transponder.
Introduction
Almost all the objects that we can see or characterize are Linear Time Invariant (LTI) systems. It implies that if they are impinged by an electromagnetic wave at a frequency Failed to parse (MathML with SVG or PNG fallback (recommended for modern browsers and accessibility tools): Invalid response ("Math extension cannot connect to Restbase.") from server "https://en.wikipedia.org/api/rest_v1/":): {\displaystyle f_0} (in input), they also reflect or backscatter an electromagnetic wave at the same frequency Failed to parse (MathML with SVG or PNG fallback (recommended for modern browsers and accessibility tools): Invalid response ("Math extension cannot connect to Restbase.") from server "https://en.wikipedia.org/api/rest_v1/":): {\displaystyle f_0} (in output).
These LTI systems can be fully characterized by their impulse response Failed to parse (MathML with SVG or PNG fallback (recommended for modern browsers and accessibility tools): Invalid response ("Math extension cannot connect to Restbase.") from server "https://en.wikipedia.org/api/rest_v1/":): {\displaystyle h(t)} in the time domain or their transfer function Failed to parse (MathML with SVG or PNG fallback (recommended for modern browsers and accessibility tools): Invalid response ("Math extension cannot connect to Restbase.") from server "https://en.wikipedia.org/api/rest_v1/":): {\displaystyle H(f)} in the frequency domain. The output signal Failed to parse (MathML with SVG or PNG fallback (recommended for modern browsers and accessibility tools): Invalid response ("Math extension cannot connect to Restbase.") from server "https://en.wikipedia.org/api/rest_v1/":): {\displaystyle y(t)} can be obtained in the time domain if the input signal Failed to parse (MathML with SVG or PNG fallback (recommended for modern browsers and accessibility tools): Invalid response ("Math extension cannot connect to Restbase.") from server "https://en.wikipedia.org/api/rest_v1/":): {\displaystyle x(t)} is known as:
Failed to parse (MathML with SVG or PNG fallback (recommended for modern browsers and accessibility tools): Invalid response ("Math extension cannot connect to Restbase.") from server "https://en.wikipedia.org/api/rest_v1/":): {\displaystyle y(t) = x(t) * h(t) }
Expression can also be derived in the frequency domain:
Failed to parse (MathML with SVG or PNG fallback (recommended for modern browsers and accessibility tools): Invalid response ("Math extension cannot connect to Restbase.") from server "https://en.wikipedia.org/api/rest_v1/":): {\displaystyle Y(f) = X(f) \times H(f) }
Classical examples include dynamical systems (electrical circuits, mechanical systems...). If we consider that the incident waveform is a continuous wave of frequency Failed to parse (MathML with SVG or PNG fallback (recommended for modern browsers and accessibility tools): Invalid response ("Math extension cannot connect to Restbase.") from server "https://en.wikipedia.org/api/rest_v1/":): {\displaystyle f_0} then its real signal can be expressed as Failed to parse (MathML with SVG or PNG fallback (recommended for modern browsers and accessibility tools): Invalid response ("Math extension cannot connect to Restbase.") from server "https://en.wikipedia.org/api/rest_v1/":): {\displaystyle x(t) = \cos 2 \pi f_0 t} . The received signal takes in that case, the simple form:
Failed to parse (MathML with SVG or PNG fallback (recommended for modern browsers and accessibility tools): Invalid response ("Math extension cannot connect to Restbase.") from server "https://en.wikipedia.org/api/rest_v1/":): {\displaystyle y(t) = |H(f_0)| \cos (2 \pi f_0 t + Arg(H(f_0))) }
where we can easily see that the backscattered signal of a LTI system can only affect the amplitude Failed to parse (MathML with SVG or PNG fallback (recommended for modern browsers and accessibility tools): Invalid response ("Math extension cannot connect to Restbase.") from server "https://en.wikipedia.org/api/rest_v1/":): {\displaystyle |H(f_0)|} and/or the phase Failed to parse (MathML with SVG or PNG fallback (recommended for modern browsers and accessibility tools): Invalid response ("Math extension cannot connect to Restbase.") from server "https://en.wikipedia.org/api/rest_v1/":): {\displaystyle Arg(H(f_0))} of the incident waveform. Note that all the received power is also located at Failed to parse (MathML with SVG or PNG fallback (recommended for modern browsers and accessibility tools): Invalid response ("Math extension cannot connect to Restbase.") from server "https://en.wikipedia.org/api/rest_v1/":): {\displaystyle f_0} since a LTI system can not generate a frequency which is not in the input signal.
Let's consider a simple example, where an environment composed of different pens on a white support is illuminated by white light as in Fig. 1. Under these conditions, note that each object is characterized by a different color since they all accept the incident power and they each reflect a tiny part of the input spectrum. However, if we replace the white light by a red light (or any monochromatic color), each object will reflect the CW with an attenuation Failed to parse (MathML with SVG or PNG fallback (recommended for modern browsers and accessibility tools): Invalid response ("Math extension cannot connect to Restbase.") from server "https://en.wikipedia.org/api/rest_v1/":): {\displaystyle |H(f_0)|} and a phase shift of Failed to parse (MathML with SVG or PNG fallback (recommended for modern browsers and accessibility tools): Invalid response ("Math extension cannot connect to Restbase.") from server "https://en.wikipedia.org/api/rest_v1/":): {\displaystyle Arg(H(f_0))} but the frequency of the reflected wave will remain at Failed to parse (MathML with SVG or PNG fallback (recommended for modern browsers and accessibility tools): Invalid response ("Math extension cannot connect to Restbase.") from server "https://en.wikipedia.org/api/rest_v1/":): {\displaystyle f_0} and the color of all object lies in between red (when attenuation is low) and black (when attenuation is high). Results are presented in Fig. 2. Almost all the objects that we see around us (like these pens and this support) are LTI systems.
This simple observation implies important constraints if we want to identify object according the their backscattered or reflected signal:
- The coding capacity only depends on the number of the color which can be distinguished. This capacity is only a function of the frequency resolution compared to the total bandwidth used by the reader. The total bandwidth used by the reader depends on the input signal. That is why we can differentiate pen under white light and not under red light.
- The associated read range is only limited by the ratio in between the power backscattered by the object compared to the power reflected by the environment at the same frequency. This condition is harder to see with the picture since, pens can be separated spatially due to the camera lens but remember that an antenna cannot detect the direction of arrival of the received power.
These limitation only appear since both pens and support (white table) are LTI systems and impose strict constraint in term of coding capacity and read range for any system based on LTI transponders.
Research Interest
My research interests include all systems which cannot be modeled by a linear time-invariant system. As a direct consequence, these systems cannot be described by an impulse response or a transfer function and are able to accept the incident power at a given frequency and reflect or backscatter (a part of) this power at an other frequency or in another bandwidth. For example, in Fig. 2, these systems could appear under the red illumination as blue of green objects... This result can be obtained by only 2 ways, breaking the linearity (i.e., non linear systems) or breaking the time invariance (i.e. linear time variant systems). A third method consist of breaking the invariance on the reader side.
Non linear systems
Transponders based on a non-linear element (such as a Schottky diode) can accept a power at Failed to parse (MathML with SVG or PNG fallback (recommended for modern browsers and accessibility tools): Invalid response ("Math extension cannot connect to Restbase.") from server "https://en.wikipedia.org/api/rest_v1/":): {\displaystyle f_0} and generate a power at Failed to parse (MathML with SVG or PNG fallback (recommended for modern browsers and accessibility tools): Invalid response ("Math extension cannot connect to Restbase.") from server "https://en.wikipedia.org/api/rest_v1/":): {\displaystyle n f_0} . Let's consider the simple circuit composed of a generator connected to a load but where a diode in inserted in serial in the circuit. The diode is a simple device which conducts the current mainly in a single direction. The relation which describe the current Failed to parse (MathML with SVG or PNG fallback (recommended for modern browsers and accessibility tools): Invalid response ("Math extension cannot connect to Restbase.") from server "https://en.wikipedia.org/api/rest_v1/":): {\displaystyle I} flowing through the diode as a function of the voltage across the junction Failed to parse (MathML with SVG or PNG fallback (recommended for modern browsers and accessibility tools): Invalid response ("Math extension cannot connect to Restbase.") from server "https://en.wikipedia.org/api/rest_v1/":): {\displaystyle V_D} can be expressed as:
Failed to parse (MathML with SVG or PNG fallback (recommended for modern browsers and accessibility tools): Invalid response ("Math extension cannot connect to Restbase.") from server "https://en.wikipedia.org/api/rest_v1/":): {\displaystyle I=I_S\left(e^{\frac {V_D}{nV_T}}-1\right) }
with Failed to parse (MathML with SVG or PNG fallback (recommended for modern browsers and accessibility tools): Invalid response ("Math extension cannot connect to Restbase.") from server "https://en.wikipedia.org/api/rest_v1/":): {\displaystyle V_T = kT/q} . If we consider a small variation of the junction voltage Failed to parse (MathML with SVG or PNG fallback (recommended for modern browsers and accessibility tools): Invalid response ("Math extension cannot connect to Restbase.") from server "https://en.wikipedia.org/api/rest_v1/":): {\displaystyle v} around a bias voltage operating point Failed to parse (MathML with SVG or PNG fallback (recommended for modern browsers and accessibility tools): Invalid response ("Math extension cannot connect to Restbase.") from server "https://en.wikipedia.org/api/rest_v1/":): {\displaystyle V_b} , the current Failed to parse (MathML with SVG or PNG fallback (recommended for modern browsers and accessibility tools): Invalid response ("Math extension cannot connect to Restbase.") from server "https://en.wikipedia.org/api/rest_v1/":): {\displaystyle i} can be expressed as Taylor series:
Failed to parse (MathML with SVG or PNG fallback (recommended for modern browsers and accessibility tools): Invalid response ("Math extension cannot connect to Restbase.") from server "https://en.wikipedia.org/api/rest_v1/":): {\displaystyle i(v) = i(V_b) + \frac{i^{(1)}}{1!} (v-V_b) + \frac{i^{(2)}(V_b)}{2!} (v-V_D)^2 + \frac{i^{(3)}(V_b)}{3!} (v-V_b)^3+\cdots }
where Failed to parse (MathML with SVG or PNG fallback (recommended for modern browsers and accessibility tools): Invalid response ("Math extension cannot connect to Restbase.") from server "https://en.wikipedia.org/api/rest_v1/":): {\displaystyle i^{(n)}} is the Failed to parse (MathML with SVG or PNG fallback (recommended for modern browsers and accessibility tools): Invalid response ("Math extension cannot connect to Restbase.") from server "https://en.wikipedia.org/api/rest_v1/":): {\displaystyle n^{\text{th}}} -derivative of Failed to parse (MathML with SVG or PNG fallback (recommended for modern browsers and accessibility tools): Invalid response ("Math extension cannot connect to Restbase.") from server "https://en.wikipedia.org/api/rest_v1/":): {\displaystyle i(v)} according to Failed to parse (MathML with SVG or PNG fallback (recommended for modern browsers and accessibility tools): Invalid response ("Math extension cannot connect to Restbase.") from server "https://en.wikipedia.org/api/rest_v1/":): {\displaystyle v} .
If an harmonic tension such as Failed to parse (MathML with SVG or PNG fallback (recommended for modern browsers and accessibility tools): Invalid response ("Math extension cannot connect to Restbase.") from server "https://en.wikipedia.org/api/rest_v1/":): {\displaystyle v(t)=A\cos \omega_0 t} is applied to this diode, its current Failed to parse (MathML with SVG or PNG fallback (recommended for modern browsers and accessibility tools): Invalid response ("Math extension cannot connect to Restbase.") from server "https://en.wikipedia.org/api/rest_v1/":): {\displaystyle i(t)} can be expressed as:
Failed to parse (MathML with SVG or PNG fallback (recommended for modern browsers and accessibility tools): Invalid response ("Math extension cannot connect to Restbase.") from server "https://en.wikipedia.org/api/rest_v1/":): {\displaystyle \begin{align} i(V_D,t) &= i(V_D) + [\frac{A^2}{4} i^{(2)}(V_b) + \frac{A^4}{64}i^{(4)}(V_b)+\cdots]\\ &+ [A i^{(1)}(V_D) + \frac{A^3}{8} i^{(3)}(V_b) + \cdots] \cos \omega_0 t\\ &+ [\frac{A^2}{4} i^{(2)}(V_b) + \frac{A^4}{48}i^{(4)}(V_b)+\cdots] \cos 2\omega_0 t\\ &+ [\frac{A^3}{24} i^{(3)}(V_b) + \frac{A^5}{384}i^{(4)}(V_b)+\cdots] \cos 3\omega_0 t\\ &+ \cdots \end{align} }
where we can see that an infinite sum of harmonics has been created due the non-linear behavior of the diode.
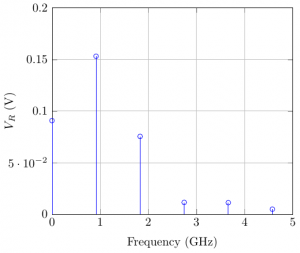
The circuit has been simulated using ngspice using the transient analysis to clearly see the effect of the non-linearity of a HSMS285x diode.
Amplitude has been set to 1V, frequency at 915 MHz. Simulation has been computed over a duration of 10 periods with 100 samples per period. Fourier series have been computed over the voltage across the load.
.title diode
.param A = 1
.param f0 = 915e6
.model hsms285x D (IS=3e-6 RS=25 N=1.06 CJO=0.18pF VJ=0.35 M=0.5 EG=0.69 XTI=2 BV=3.8 IBV=3e-4)
V1 1 0 dc 0 SIN(0 A f0 0NS 0)
Ra 2 1 50
D1 2 3 hsms285x
Rl 3 0 50
.end

.csparam csf0 = {f0}
.csparam duration = {10.0/f0}
.csparam fsample = {1/(100*f0)}
.control
  tran $&fsample $&duration
  plot v(3)
  fourier $&csf0 v(3)
.endc
The simulation clearly shows that the power dissipated into the load contains power at Failed to parse (MathML with SVG or PNG fallback (recommended for modern browsers and accessibility tools): Invalid response ("Math extension cannot connect to Restbase.") from server "https://en.wikipedia.org/api/rest_v1/":): {\displaystyle f_0} but also at Failed to parse (MathML with SVG or PNG fallback (recommended for modern browsers and accessibility tools): Invalid response ("Math extension cannot connect to Restbase.") from server "https://en.wikipedia.org/api/rest_v1/":): {\displaystyle n f_0} due to the non-linear behavior of the diode. Harvesters use the power located at Failed to parse (MathML with SVG or PNG fallback (recommended for modern browsers and accessibility tools): Invalid response ("Math extension cannot connect to Restbase.") from server "https://en.wikipedia.org/api/rest_v1/":): {\displaystyle n=0} where as harmonic transponders are based on the power located at Failed to parse (MathML with SVG or PNG fallback (recommended for modern browsers and accessibility tools): Invalid response ("Math extension cannot connect to Restbase.") from server "https://en.wikipedia.org/api/rest_v1/":): {\displaystyle n > 1} .
For passive harmonic transponders, an antenna accepting the power at Failed to parse (MathML with SVG or PNG fallback (recommended for modern browsers and accessibility tools): Invalid response ("Math extension cannot connect to Restbase.") from server "https://en.wikipedia.org/api/rest_v1/":): {\displaystyle f_0} have to be added. The backscattered power at Failed to parse (MathML with SVG or PNG fallback (recommended for modern browsers and accessibility tools): Invalid response ("Math extension cannot connect to Restbase.") from server "https://en.wikipedia.org/api/rest_v1/":): {\displaystyle n f_0} should also be re-radiated by another antenna. The main difficulty appears from the incident power which is very low (few micro Watt) which need to generate a voltage higher than the threshold of the diode (around 0.3 V). Usually the conversion loss associated to these devices is lower than -20 dB (i.e. only 1% of the incident power is converted to another frequency). However, read range of these transponders can easily achieve more than 5 m while satisfying regulation standards.
Linear time variant systems
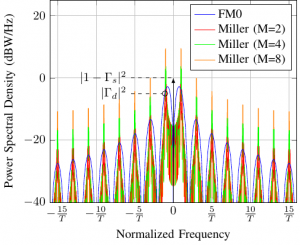
These class of transponders include many examples. The more famous ones are classical RFID tags. UHF RFID tags can, when a sufficient power is received by the chip, switch the internal load connected to the antenna in between 2 values, its RCS is also modified and becomes a function of the time. Finally the variations of the backscattered signal generate a modulation which can be detected by the reader. As a direct consequence, the backscattered power spectral density includes components which are not at Failed to parse (MathML with SVG or PNG fallback (recommended for modern browsers and accessibility tools): Invalid response ("Math extension cannot connect to Restbase.") from server "https://en.wikipedia.org/api/rest_v1/":): {\displaystyle f_0} . If the transmission data rate is much lower than the carrier frequency, narrow band signal approximation holds and PSD is located around Failed to parse (MathML with SVG or PNG fallback (recommended for modern browsers and accessibility tools): Invalid response ("Math extension cannot connect to Restbase.") from server "https://en.wikipedia.org/api/rest_v1/":): {\displaystyle f_0} . The exact characteristics of the PSD depends on the data encoding used by the tag during the communication. The UHF RFID standard defines two different modulations for the tag which are FM0 and Miller (with different subcarrier sequences). Analytical formula of the PSD for FM0 is known and is equal to the Manchester encoding. For Miller modulation, analytical formula is also known, but without considering the subcarrier sequences. Fig. 5 presents the PSD of the baseband signals corresponding to the different modulations used by the tag. For all modulation we can see that the PSD is spread around Failed to parse (MathML with SVG or PNG fallback (recommended for modern browsers and accessibility tools): Invalid response ("Math extension cannot connect to Restbase.") from server "https://en.wikipedia.org/api/rest_v1/":): {\displaystyle f_0} and that the system can not be considered as a LTI system.
Another example appears when objects are moved or rotated into space. This interesting phenomenon is better illustrated by considering the simple case where a target is impinged by a continuous wave at a frequency Failed to parse (MathML with SVG or PNG fallback (recommended for modern browsers and accessibility tools): Invalid response ("Math extension cannot connect to Restbase.") from server "https://en.wikipedia.org/api/rest_v1/":): {\displaystyle f_0}
, if the radial speed of the target compared to the antenna is not zero, Doppler effect actually modifies the backscattered wave frequency received by the antenna which can be expressed as:
Failed to parse (MathML with SVG or PNG fallback (recommended for modern browsers and accessibility tools): Invalid response ("Math extension cannot connect to Restbase.") from server "https://en.wikipedia.org/api/rest_v1/":): {\displaystyle f=\left(\frac {c}{c\pm v_s}\right)f_0 }
Periodical movements of frequency Failed to parse (MathML with SVG or PNG fallback (recommended for modern browsers and accessibility tools): Invalid response ("Math extension cannot connect to Restbase.") from server "https://en.wikipedia.org/api/rest_v1/":): {\displaystyle f_r}
, such as vibrations and rotations, lead to simple analytical expressions where the backscattered spectrum is composed of discrete peaks located at Failed to parse (MathML with SVG or PNG fallback (recommended for modern browsers and accessibility tools): Invalid response ("Math extension cannot connect to Restbase.") from server "https://en.wikipedia.org/api/rest_v1/":): {\displaystyle f_0 \pm n f_r}
. Let's consider a vertical dipole oriented along Failed to parse (MathML with SVG or PNG fallback (recommended for modern browsers and accessibility tools): Invalid response ("Math extension cannot connect to Restbase.") from server "https://en.wikipedia.org/api/rest_v1/":): {\displaystyle z}
located at Failed to parse (MathML with SVG or PNG fallback (recommended for modern browsers and accessibility tools): Invalid response ("Math extension cannot connect to Restbase.") from server "https://en.wikipedia.org/api/rest_v1/":): {\displaystyle x=5}
cm and Failed to parse (MathML with SVG or PNG fallback (recommended for modern browsers and accessibility tools): Invalid response ("Math extension cannot connect to Restbase.") from server "https://en.wikipedia.org/api/rest_v1/":): {\displaystyle y=0}
cm and impinged by a plane wave at 915 MHz propagating along Failed to parse (MathML with SVG or PNG fallback (recommended for modern browsers and accessibility tools): Invalid response ("Math extension cannot connect to Restbase.") from server "https://en.wikipedia.org/api/rest_v1/":): {\displaystyle y}
. If we rotate this dipole along the Failed to parse (MathML with SVG or PNG fallback (recommended for modern browsers and accessibility tools): Invalid response ("Math extension cannot connect to Restbase.") from server "https://en.wikipedia.org/api/rest_v1/":): {\displaystyle z}
axis with a frequency Failed to parse (MathML with SVG or PNG fallback (recommended for modern browsers and accessibility tools): Invalid response ("Math extension cannot connect to Restbase.") from server "https://en.wikipedia.org/api/rest_v1/":): {\displaystyle f_r}
, the phase backscattered electric field in farfield is modulated by a sinus function while the magnitude remains constant (micro-Doppler). This situation can easily by simulated with nec2:
CE MICRO-DOPPLER
GW 0 50 -0.0165 0.05 0. 0.0165 0.05 0. 0.0005
GM 0 0 0. 0. 0. 0. 0. 0.
GE
EX 1 1 1 0 0 0 0 0 0 0
FR 0 1 0 0 915e6 0
RP 0 1 1 1000 0 0 0 0 1
EN
By changing the GM card, the backscattered signal can be determined for all Failed to parse (MathML with SVG or PNG fallback (recommended for modern browsers and accessibility tools): Invalid response ("Math extension cannot connect to Restbase.") from server "https://en.wikipedia.org/api/rest_v1/":): {\displaystyle \theta}
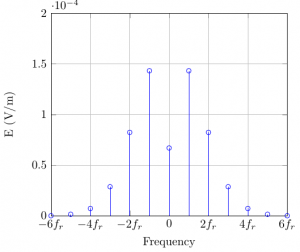
values. Fourier series of this signal can be computed and lead to a discrete spectrum at Failed to parse (MathML with SVG or PNG fallback (recommended for modern browsers and accessibility tools): Invalid response ("Math extension cannot connect to Restbase.") from server "https://en.wikipedia.org/api/rest_v1/":): {\displaystyle k f_r}
presented in Fig. 4. Analytical form is identical to a frequency modulated signal with an index modulation of Failed to parse (MathML with SVG or PNG fallback (recommended for modern browsers and accessibility tools): Invalid response ("Math extension cannot connect to Restbase.") from server "https://en.wikipedia.org/api/rest_v1/":): {\displaystyle \beta = 1.92}
and can be expressed as a function of the Bessel function of first kind.
Finally, note that for every modification of the response of the transponder during the interrogation done by the reader implies a modulation of the backscattered signal in time which generate a non-zero power in the PSD around Failed to parse (MathML with SVG or PNG fallback (recommended for modern browsers and accessibility tools): Invalid response ("Math extension cannot connect to Restbase.") from server "https://en.wikipedia.org/api/rest_v1/":): {\displaystyle f_0} . However these modifications require an energy source which can be brought by the reader itself (as in UHF RFID) or by an external action (as the displacement or rotation of the tag). In these latter case, transponders can be considered as semi-passive.
Imaging systems
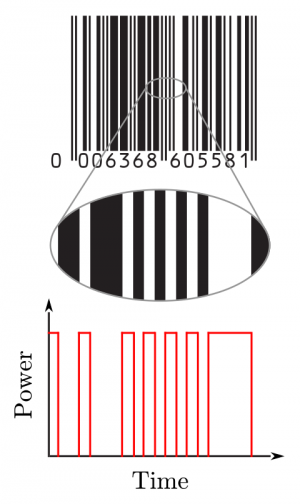
Imaging systems are a special kind of linear time variant system where the variations are not produced by the tag but by the reader itself. In this case, the tag remains a LTI systems, but the reading method done by the reader allows to extract the tag response as a function of variation in time which break the invariance propertie. These tags (and the associated reading method) are not limited by the bounds on coding capacity and read range. The simplest example is the barcode and is presented in Fig. 5. Classical barcodes are composed of black stripes and can encode 43 bits of information. Barcodes are read by sweeping the beam produced by a laser diode along the tag and by measuring the variations of the reflected signal in time. Scientists often usually consider that chipless technology is more related to barcodes than UHF technology, however, note that the reflected signal of a barcode is a modulated signal which is, by principle, identical to the backscattered signals of UHF RFID and moving or rotating tags. As such, barcodes and their reading method cannot be considered as LTI systems and are characterized by a non-zero delta RCS and a (possible) much larger read range.
This spatial diversity allows to use the same color multiple time to encode information (stripes do not have to use a different color and 2 colors are enought) which significantly increases the coding capacity. 2D images and their associated reading method can also be considered as linear time variant systems (which include QR code, or any image obtained with a lens and camera sensor). All these systems operate in the optical domain since spatial resolution is only limited by the small beam divergence of laser diodes (less than 1 mrad) or the sensor matrix size of camera sensors. However, note that when frequency is decreased, antenna directivity is also reduced which significantly limits the performance of this approach in the RF domain. For example in UWB band half power angle is usually higher than 10° which imposes large separation in between stripes (or resonators).
Conclusion
I hope you have liked this page. If you have any comment, remarks or questions about these ideas, feel free to send me an email:
nicolas.barbot@lcis.grenoble-inp.fr
Collaborations often start by simple emails...

